By Bill Meade
As we were writing ‘The pocket guide to invention workshops’ Bob Sesek (HP super-inventor with 600 disclosures and forty-some patents issued) came up with a great graphic to visualize the inventing which was and was not happening. Here it is:

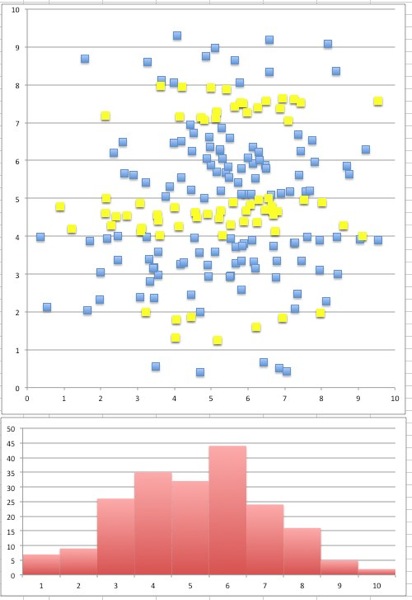
The blue boxes are ideasthat could be disclosed, but which are not disclosed. The yellow boxes are disclosable ideas that are captured by an IP system. Our workshops have shown that what IP attorneys suspect, is correct. Very few of the technology ideas people have, are captured.
So far, so good. I was back flipping because Bob came up with a way to show graphically, something I’ve been groping to articulate for a long time.
Next step in visualizing invention was a build on Bob’s idea that allowed “strategic” IP to be visualized as well. Here is my build on Bob’s idea:

What I like about this, is that what is strategic is separate from the idea of patentability. Many of our clients don’t necessarily want 100% patenting of inventions captured. They even want non-patentable ideas that are strategic. Patentability is not the only source of worth of an invention disclosure.
So, I’m liking this graphic very much. But, Bob hates it. He does not like my most excellent 45 degree strategic patenting targets. I liked my targets because they allowed me to show what happens when inventors get calibrated. What happens when inventors learn the criteria their inventions are being evaluated with is that the inventing becomes like this:

The inventors “get” that strategic ideas are important even when not patentable, and they mop up their minds of the un-disclosed remainder ideas. Then, they efficiently disclose down the target list. And when the idea quality is high enough, they can judge for themselves that the ideas should be turned in.
So, I’m happy, but Bob still thinks this stinks. So, we got to talking about it, and realized that we see inventing in complementary ways. Not a surprise, while I’ve got 4 issued patents, I see the world primarily as an IP manager, and Bob sees the world primarily as an inventor. To stitch what Bob sees in strategic inventing, to what I’m seeing take a look at this:

Bob sees ideas spread across technology space (Y axis) and then quality (X axis). I was content to clumsily overlay strategic patenting targets on the frequency plot of ideas. Bob then pulled the strategic patent targets off my density plot, and put the strategic targets where he sees that they naturally belong. That is, in the technology space.
So that is where we stand as of today. We’re able to generate inventions across technologies and quality, in approximately normal distributions (see last image). This feels like a stepping stone to predictive IP management, or something else cool. Hope you enjoy!

[…] Visualizing invention (ipstrategy.com) […]